“Bitcoin is not a Safe Haven.”

Premise 1. If an asset’s price goes down during a crisis, then that asset is not a “safe haven.”

Premise 2. Bitcoin’s price went down during a crisis.

Therefore:

Conclusion 3. Bitcoin is not a safe haven.

Evaluation:

Premise 1. “If an asset’s price goes down during a crisis, then that asset is not a ‘safe haven.’” Dubious. By this definition, every asset has the potential to lose its “safe haven” status (if its price goes down – even “temporarily” – during a crisis), which should strike the reader as “obviously flawed” and most definitely not a useful label.

In fact, the claims that an asset “is or is not a safe haven because of its price movements [in the short term]” are all subject to the “no true Scotsman fallacy,” also known as an “appeal to purity.” If, with each new economic “crisis,” a pundit can change the timeline, the loss or gain threshold, or some other criteria to classify an asset as either “safe haven” or not, then such an argument is invalid and such a definition is unusable.

A much stronger approach would be to define a “safe haven” by the overall nature of how money flows into and out of the asset throughout its entire lifetime, and NOT update the definition of a “safe haven” with each new “crisis.” See below.

Premise 2. “Bitcoin’s price went down during a crisis.” Agree, lol.

Therefore:

Conclusion 3. “Bitcoin is not a safe haven.” Disagree. This Argument, because of Premise 1, is not sufficient to establish the conclusion that “Bitcoin is not a safe haven asset,” but it’s possible that other Arguments would be sufficient to establish this claim.

Risk Assets vs. Safe Haven Assets

The beauty of “the markets” is that they capture the size and strength of everyone’s opinions, all over the world, at all points in time: all the lovers and haters of an asset, all of the PhD economists and the high school dropouts, all of the professional hedge fund managers and the amateurs with a hunch – everyone’s opinions are constantly and consistently captured in the price of an asset.

The price of an asset, therefore, signals the “revealed preferences of the aggregate” over time, and if we look at a long-enough time horizon, we can see how generations of individuals (and institutions!) around the world view a particular asset.

So what types of price movements do we see?

As you might expect, we see two broad types of price movements:
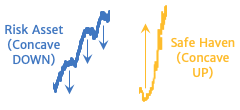
Risk Assets vs. Safe Haven Assets simplified
  1. One type of asset “inches” upward most of the time, experiences a rounded top, and a quick downward spike during its “corrections.” Then the pattern repeats, and it does so relatively quickly and frequently. This type of asset enjoys long bull markets and short bear markets. Notably, the absolute largest single-day movements of all time are actually downward.
  2. The other type of asset typically moves downward or sideways most of the time, experiences a rounded bottom, and a quick upward spike during its “corrections.” This pattern repeats very slowly and infrequently, but the magnitude of the movements is much greater. This type of asset endures long bear markets and short bull markets. Notably, the absolute largest single-day movements of all time are upward.

The two types of assets described above are risk assets and safe haven assets, respectively.

Here is a chart illustrating the prime example of each asset type – stocks and gold:
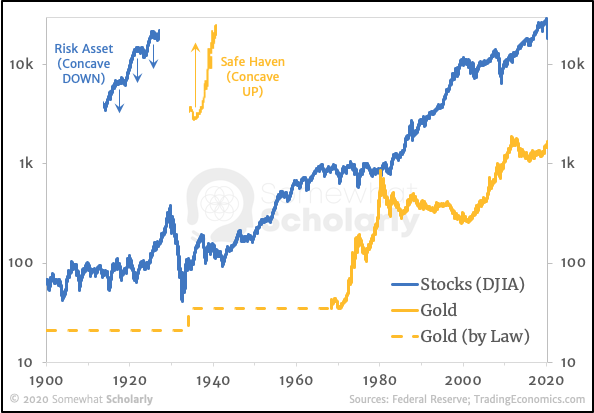
Risk vs. Safe - Stocks vs. Gold 1900 - 2020

Notice that Stocks exhibit a repeating pattern of steady uphill climb, rounded top, and quick spike down. Then the pattern repeats. Gold, on the other hand, exhibits a pattern of flat movement, then a rounded bottom, and a quick spike up.

Interestingly, there's another important pattern that emerges, but it's only apparent when we analyze the numbers more deeply: in a risk asset, the biggest single-day moves (up and down) tend to occur during a bear market, whereas in a safe haven asset, the biggest single-day moves (up and down) tend to occur during a bull market:
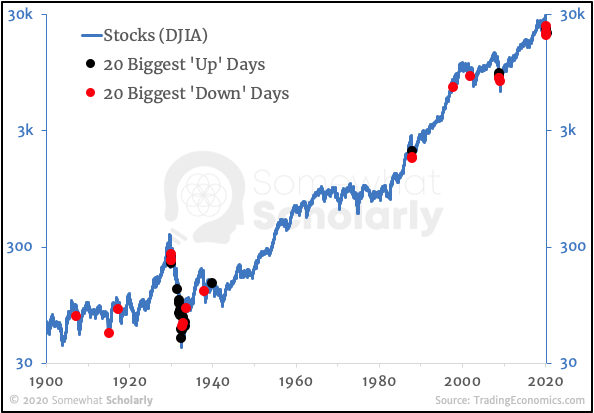
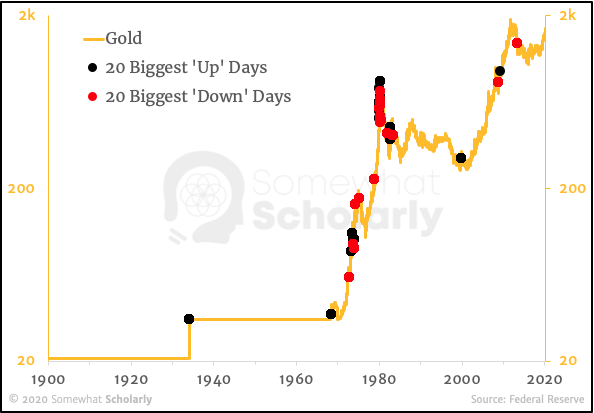
Stocks since 1900 with 20 Biggest Up and Down Days, joined
Gold since 1900 with 20 Biggest Up and Down Days, joined

In other words, big record-breaking single-day volatility is typically a sign of a bear market for risk assets, and a bull market for safe haven assets.

For those curious of the magnitudes of each single-day move, here’s the same information with the magnitude of the daily change (%) plotted on the left axis:
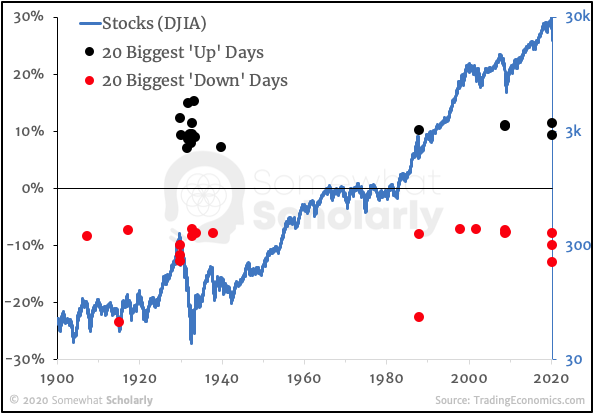
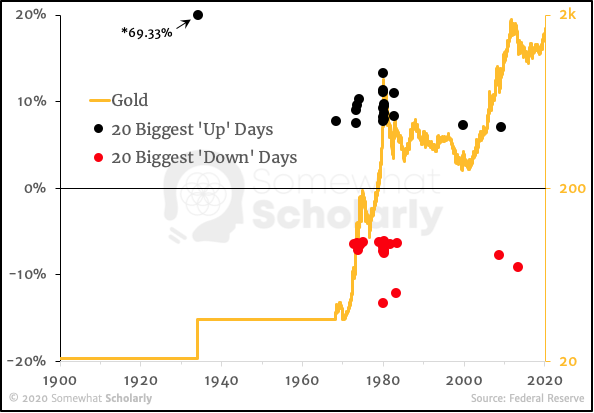
Stocks since 1900 with 20 Biggest Up and Down Days, split
Gold since 1900 with 20 Biggest Up and Down Days, split

What about Bitcoin?

Of course, we don’t have the luxury of a 120-year price history, so we’ll have to suffice with just 10 years.

Here’s Bitcoin’s price history with the 10 largest one-day price moves up and down. [Note that I’ve highlighted only the 10 biggest days, not 20, since the price history is so much shorter]:
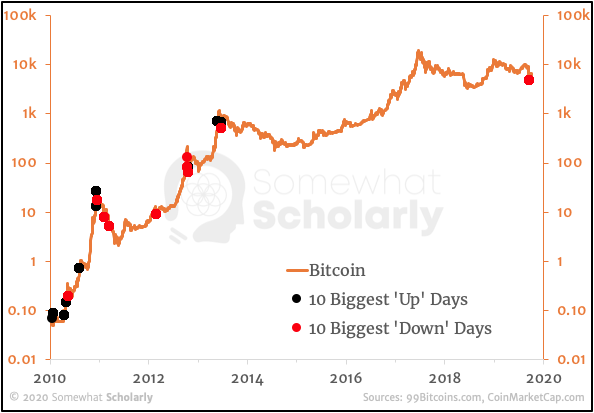
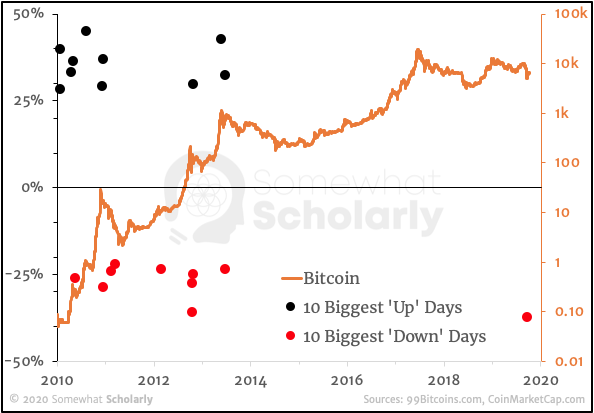
Bitcoin since 2010 with 10 Biggest Up and Down Days, joined
Bitcoin since 2010 with 10 Biggest Up and Down Days, split

As you can see, the biggest one-day moves tend to occur during a bull market, just like a safe haven.

While the timing of big moves is interesting, it’s not our primary criterion for establishing an asset as a safe haven.

Instead, let’s look at the shape of Bitcoin’s overall price trajectory, and compare it to Gold’s price trajectory since it became “freely traded” in April 1968 (after the collapse of the London Gold Pool):
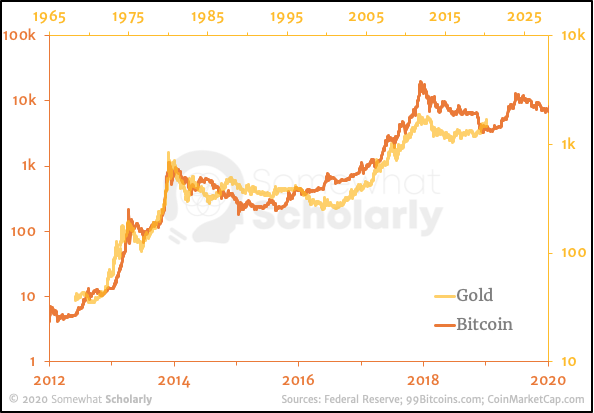
Bitcoin and Gold have similar Safe Haven trajectories

You’ll notice that I’ve slightly adjusted the horizontal time scales to highlight the staggering similarity in the shape of their price trajectories over time.

Here’s the same time comparison between Bitcoin and Stocks:
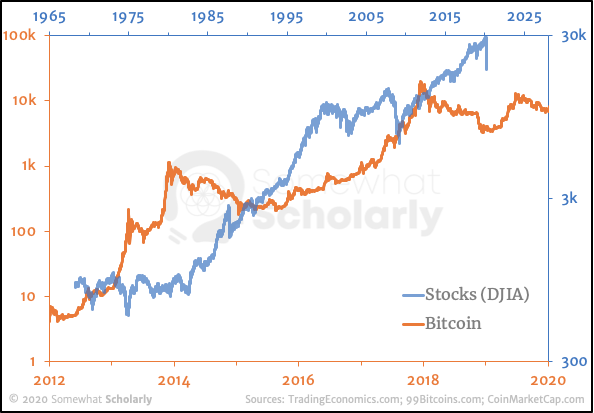
Bitcoin and Stocks have dissimilar trajectories

As you can see, Bitcoin and Stocks are not even close to moving in a similar way.

Key Takeaway

Remember, we’re defining a “safe haven” based on the overall behavior of every person in the world – including those who bet for an asset, against an asset, and those who sit on the sidelines.

We’re not interested in what people say about an asset – only in how people actually act.

The collective behavior of the market reveals that people largely ignore Bitcoin and Gold on a day-to-day basis (while instead focusing on Stocks or other “risk assets”), and then, occasionally, they flip their focus – rushing out of Stocks and into Bitcoin and Gold.

For these reasons, Bitcoin is a safe haven asset, just like gold.


Have I missed something? I welcome your constructive criticism and your evaluation of my Arguments.

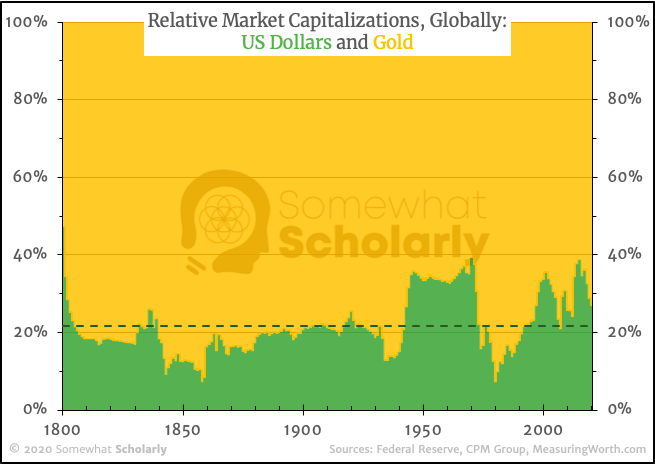
Gold vs. Dollar (Market Cap since 1800)

The long-term (220-year) average ratio of market capitalizations is 21.7% Dollars to 78.3% Gold.

The average pre-Fed (pre-1914) ratio is 18.2% to 81.8%.
The average post-Fed (post-1914) ratio is 25.3% to 74.7%.

The all-time-maximum dollar ratio was 39.1% in 1970, immediately before a 10-year bull market in the dollar price of gold (25x), which lowered the dollar ratio to 7.2% in 1980; incidentally, this is the dollar's all-time-minimum ratio.

The second-highest dollar ratio was 38.6% in 2015. If the ratio reverts to the historical low (7.2%), concurrent with a 1970's-like increase in the gold supply (1.2x) and dollar supply (2.4x), then the following values are implied for the year 2025:

  • Monetary base: $9.17 trillion
  • Gold supply: 6.19 billion ounces
  • Gold market capitalization: $118.6 trillion
  • Gold price per ounce: $19,100.00

Worth considering.

“Gold is not a hedge against price deflation.”

Premise 1. If the price of an asset goes down while the overall price level in an economy goes down (i.e. during “price deflation”), then such an asset is not a hedge against price deflation.

Premise 2. The price of gold often goes down during price deflations.

Therefore:

Conclusion 3. Gold is not a hedge against price deflation.

Definitions:

1. “Deflation,” in this post, means “falling prices,” NOT “a contraction of the money supply.”

2. “Hedge” means "a vehicle to preserve purchasing power.”
[By this definition, we could establish an asset as a hedge if its price does not fall as quickly as other prices fall, since its purchasing power would be intact under such circumstances.]

Assumptions:

3. Although the label of “hedge” is often used in a binary sense (i.e. an asset either (1) is or (2) is not a hedge), we’re choosing to establish the quality of a hedge along a spectrum. In other words, we want to answer the question, “how good of a hedge against deflation is gold?”

4. Since the average investor is not a day-trader or swing-trader, we will not use days, weeks, or months for our analysis. Instead, we will use annual data points from 1800 to 2020, reflecting a 220-year period in the United States. [If you want to hedge your purchasing power for one year or less, then this analysis is not for you.]

Evaluation:

Premise 1. "If the price of an asset goes down while the overall price level in an economy goes down (i.e. during “price deflation”), then such an asset is not a hedge against price deflation." Dubious. Generally speaking, I agree, but as we mentioned in Definition 2, one could make the case that a successful hedge simply needs to fall less than other prices fall. But since this distinction is not central to our analysis, let’s assume we agree with Premise 1 as it’s written.

Premise 2. "The price of gold often goes down during price deflations." Disagree. This claim, for some reason, seems to circulate widely. As you can see below (on an annual time scale), it is simply not true:

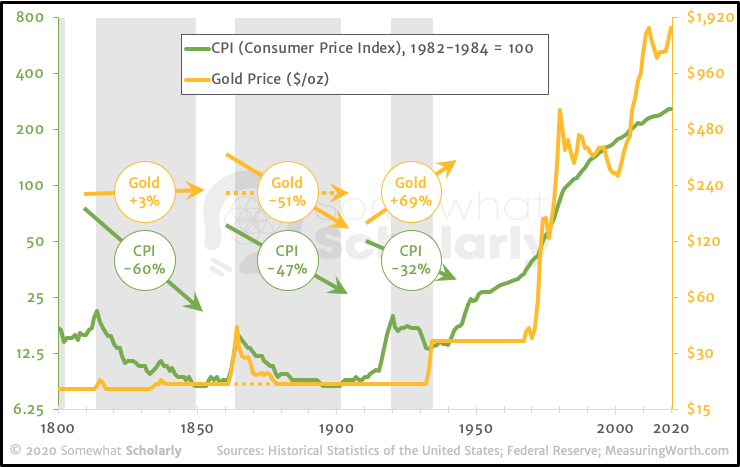
Gold is Not a Hedge against Price Deflation

In the chart above, the vertical gray bars indicate the 3 major deflationary periods in the United States; the green and yellow circles highlight the changes in the Consumer Price Index (CPI) and the price of Gold during those periods, respectively. The dotted yellow line (and arrow) represent the price of gold if the United States had not fought the Civil War (1861-1865).

You can see that prices dropped 60% in the early-to-mid-1800’s, and gold’s price rose 3%. Following the Civil War, prices dropped 47% and gold’s price dropped 51%. During the boom-bust of the Roaring Twenties and Great Depression (1920-1934), prices dropped 32% and gold’s price rose 69%.

With the exception of the Civil War, the price of gold tends to go up during price deflations.

Obviously, the Civil War was not a typical event, and the doubling of the gold price in 3 years (which was also a doubling of its all-time-high) was a serious clue of the rarity of the situation. Indeed, the year 1864 – at the height of the war and the height of the price boom – was the only bad year to buy gold in the 19th century. [But of course, if you buy anything at its all-time-high, you’ve chosen the wrong time to buy].

If you had bought gold before the war, you could sell any time thereafter and NOT lose money – you’d either break even or turn a profit, regardless if prices in the economy were rising or falling.

And of course, if the price of gold remains steady while the CPI is falling, your purchasing power is constantly increasing while you hold gold.

Therefore:

Conclusion 3. “Gold is not a hedge against price deflation.” Disagree. This is clearly false. Gold is an excellent hedge against price deflation, especially if you don’t buy when it’s at its all-time-high.

Remember, this assumes that you’re looking to hedge your purchasing power for several years, not several days, and it’s also not a claim about monetary deflation (i.e. a reduction in the money supply). That’s a topic for a separate post.

Have I missed something? Please share in the Comments.

You may also like:
"In a healthy economy, prices go up."

“In a healthy economy, prices go up.”

Premise 1. In a healthy economy, the Demand for goods and services tends to increase.

Premise 2. When Demand for goods and services increases, prices go up.

Therefore:

Conclusion 3. In a healthy economy, prices go up.

Evaluation:

Premise 1. "In a healthy economy, the Demand for goods and services tends to increase." Dubious. While it's true that Demand tends to rise with income, it's also true that Demand declines with age. In other words, a person tends to Demand less as they get older.

The truth of this Premise is unclear, but let's suppose we Agree.

Premise 2. "When Demand for goods and services increases, prices go up." Disagree. This Premise is true ceteris paribus, meaning "all else equal," but in the real world, it's never the case that "all else is equal."

In a healthy economy (i.e. one in which (1) saving and (2) innovation are both encouraged and rewarded), the Supply of goods and services will tend to increase faster than Demand (because useful innovations will increase Supply, and people can't Demand those new goods and services until after they've been produced, so Demand "lags," or "follows," or moves slower than Supply).

The net effect on the economy (when Demand and Supply are both increasing) is a higher Quantity of goods and services sold, typically at a lower Price (see Chart below).

Therefore:

Conclusion 3. "In a healthy economy, prices go up." Disagree. In a healthy economy,* prices go down.

*[A "healthy economy" is one in which (1) saving and (2) innovation are encouraged and rewarded... via (1) sound money, (2) low taxes, and (3) minimal regulations.]


Evidence:

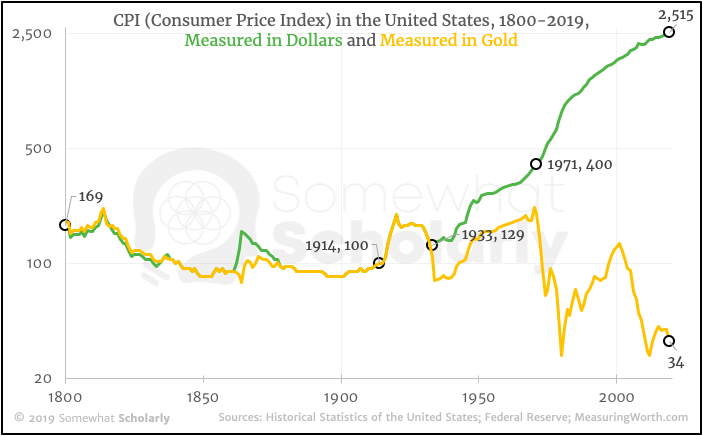
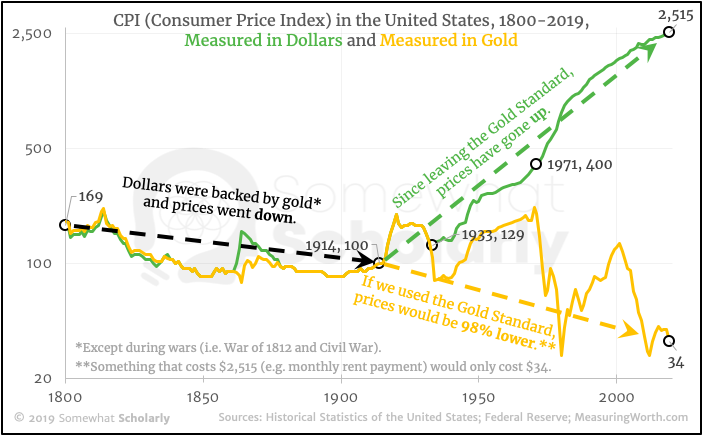
Here's the Consumer Price Index (i.e. the average level of prices) in the United States from 1800 - 2019. As you can see, during the first century (when the dollar was backed by gold), the general trend is downward. In other words, prices go down:

CPI in the US, 1800-2019

During the last century, the Federal Reserve (a for-profit corporation created in 1913 that acts independently of the government) has printed so many dollars - at such a rapid pace - that it forced the U.S. government to partially abandon the gold standard in 1933, and completely abandon the gold standard in 1971.

The Fed continues to print dollars at an exponential rate, and the effect on the economy is clear: since 1914 (the first year of the Fed's monetary policy), prices have increased more than 25x. [Green line in Chart].

Quite simply, the monetary policy of the Federal Reserve (i.e. printing dollars) has made it much more difficult for the average person to buy things, unless he or she owns gold:

If we divide the CPI by the dollar-price of gold (to measure prices in ounces of gold - i.e. real money that cannot be printed), we find that prices dropped 66% since 1914. In other words: if you own gold (or use money backed by gold), prices go down. [Gold line in Chart].


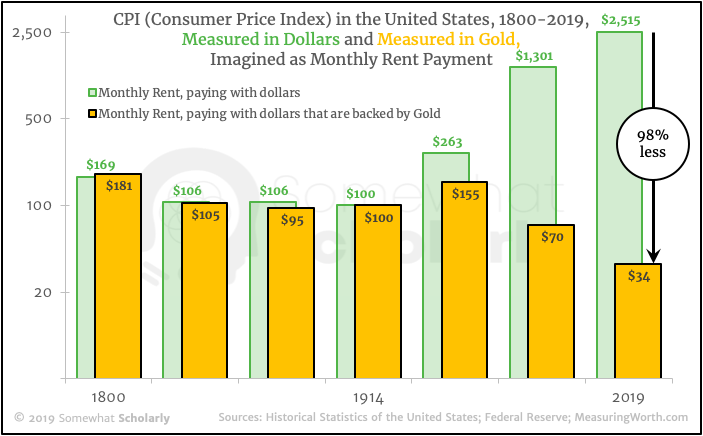
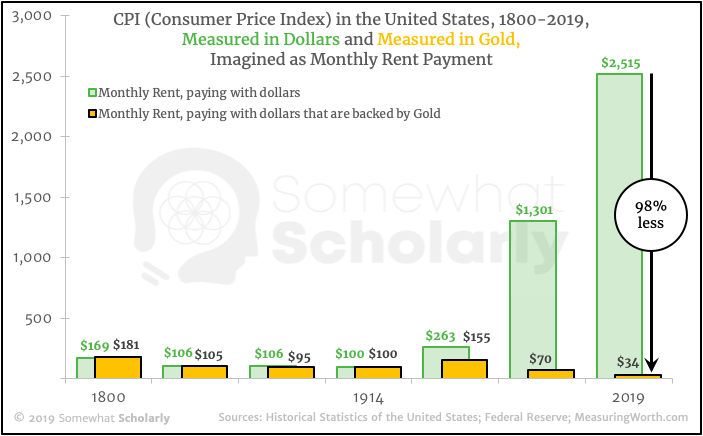
For those who want to imagine what "falling prices" would actually feel like on a personal basis, imagine that the CPI is actually your monthly rent payment. [You could also imagine that it's the price of a gallon of milk, or a loaf of bread, or anything else that you buy weekly, monthly, or yearly]. Would you prefer that these items cost more every week, or less? (It's not a trick question).

Below is the same CPI data from above, but imagined as a monthly rent payment.

Notice that there's really "no difference" between the dollar-price of rent and the gold-price of rent for over a hundred years (i.e. they both get cheaper, slowly, at about the same rate). This pattern changes abruptly in 1914 (i.e. the first year of the Federal Reserve's monetary policy), when the two prices start to diverge wildly:

CPI in the US, 1800-2019, Imagined as Monthly Rent

If you're wondering why the difference in 2019 doesn't look like 98%... it's because the vertical axis uses a logarithmic scale.

Here's the same graph with a linear scale:

CPI in the US, 1800-2019, Monthly Rent, Linear

Without a gold standard, a central bank can print unlimited amounts of fiat currency; this inflation punishes people who try to Save money, which in turn creates a mild state of "panic buying" that can last for generations.

If you expect prices to go up tomorrow, you'd better buy something today, even if you don't really need it; otherwise, you're choosing to get poorer.

As an added twist, the economists at the Federal Reserve point to all the "increased spending" (on goods and services that people don't really want) as "evidence" that the economy is "growing," but in reality, this panic buying is a symptom of a troubled economy - not a healthy one.


On a gold standard, however, this "theft by inflation" is not possible. In fact, the average person gets richer (i.e. can "buy more stuff over time") just by Saving money. When prices go down over time, you can afford more tomorrow than you can afford today. And the longer you Save, the richer you get.

But that only happens if you use sound money.

So the question must be asked:

Would you rather live under the Federal Reserve's monetary policy, or on the Gold Standard?

You may also like:
"Gold is not a hedge against price deflation."