Gold vs. Dollar (Market Cap since 1800)

The long-term (220-year) average ratio of market capitalizations is 21.7% Dollars to 78.3% Gold.

The average pre-Fed (pre-1914) ratio is 18.2% to 81.8%.
The average post-Fed (post-1914) ratio is 25.3% to 74.7%.

The all-time-maximum dollar ratio was 39.1% in 1970, immediately before a 10-year bull market in the dollar price of gold (25x), which lowered the dollar ratio to 7.2% in 1980; incidentally, this is the dollar's all-time-minimum ratio.

The second-highest dollar ratio was 38.6% in 2015. If the ratio reverts to the historical low (7.2%), concurrent with a 1970's-like increase in the gold supply (1.2x) and dollar supply (2.4x), then the following values are implied for the year 2025:

  • Monetary base: $9.17 trillion
  • Gold supply: 6.19 billion ounces
  • Gold market capitalization: $118.6 trillion
  • Gold price per ounce: $19,100.00

Worth considering.

“In a healthy economy, prices go up.”

Premise 1. In a healthy economy, the Demand for goods and services tends to increase.

Premise 2. When Demand for goods and services increases, prices go up.

Therefore:

Conclusion 3. In a healthy economy, prices go up.

Evaluation:

Premise 1. "In a healthy economy, the Demand for goods and services tends to increase." Dubious. While it's true that Demand tends to rise with income, it's also true that Demand declines with age. In other words, a person tends to Demand less as they get older.

The truth of this Premise is unclear, but let's suppose we Agree.

Premise 2. "When Demand for goods and services increases, prices go up." Disagree. This Premise is true ceteris paribus, meaning "all else equal," but in the real world, it's never the case that "all else is equal."

In a healthy economy (i.e. one in which (1) saving and (2) innovation are both encouraged and rewarded), the Supply of goods and services will tend to increase faster than Demand (because useful innovations will increase Supply, and people can't Demand those new goods and services until after they've been produced, so Demand "lags," or "follows," or moves slower than Supply).

The net effect on the economy (when Demand and Supply are both increasing) is a higher Quantity of goods and services sold, typically at a lower Price (see Chart below).

Therefore:

Conclusion 3. "In a healthy economy, prices go up." Disagree. In a healthy economy,* prices go down.

*[A "healthy economy" is one in which (1) saving and (2) innovation are encouraged and rewarded... via (1) sound money, (2) low taxes, and (3) minimal regulations.]


Evidence:

Here's the Consumer Price Index (i.e. the average level of prices) in the United States from 1800 - 2019. As you can see, during the first century (when the dollar was backed by gold), the general trend is downward. In other words, prices go down:

CPI in the US, 1800-2019

During the last century, the Federal Reserve (a for-profit corporation created in 1913 that acts independently of the government) has printed so many dollars - at such a rapid pace - that it forced the U.S. government to partially abandon the gold standard in 1933, and completely abandon the gold standard in 1971.

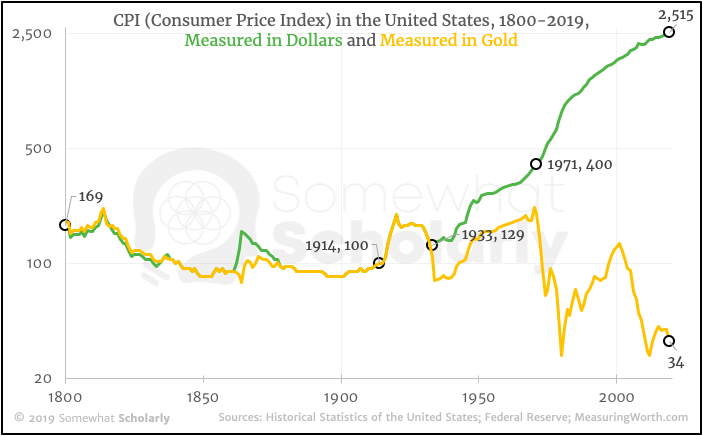
The Fed continues to print dollars at an exponential rate, and the effect on the economy is clear: since 1914 (the first year of the Fed's monetary policy), prices have increased more than 25x. [Green line in Chart].

Quite simply, the monetary policy of the Federal Reserve (i.e. printing dollars) has made it much more difficult for the average person to buy things, unless he or she owns gold:

If we divide the CPI by the dollar-price of gold (to measure prices in ounces of gold - i.e. real money that cannot be printed), we find that prices dropped 66% since 1914. In other words: if you own gold (or use money backed by gold), prices go down. [Gold line in Chart].


For those who want to imagine what "falling prices" would actually feel like on a personal basis, imagine that the CPI is actually your monthly rent payment. [You could also imagine that it's the price of a gallon of milk, or a loaf of bread, or anything else that you buy weekly, monthly, or yearly]. Would you prefer that these items cost more every week, or less? (It's not a trick question).

Below is the same CPI data from above, but imagined as a monthly rent payment.

Notice that there's really "no difference" between the dollar-price of rent and the gold-price of rent for over a hundred years (i.e. they both get cheaper, slowly, at about the same rate). This pattern changes abruptly in 1914 (i.e. the first year of the Federal Reserve's monetary policy), when the two prices start to diverge wildly:

CPI in the US, 1800-2019, Imagined as Monthly Rent

If you're wondering why the difference in 2019 doesn't look like 98%... it's because the vertical axis uses a logarithmic scale.

Here's the same graph with a linear scale:

CPI in the US, 1800-2019, Monthly Rent, Linear

Without a gold standard, a central bank can print unlimited amounts of fiat currency; this inflation punishes people who try to Save money, which in turn creates a mild state of "panic buying" that can last for generations.

If you expect prices to go up tomorrow, you'd better buy something today, even if you don't really need it; otherwise, you're choosing to get poorer.

As an added twist, the economists at the Federal Reserve point to all the "increased spending" (on goods and services that people don't really want) as "evidence" that the economy is "growing," but in reality, this panic buying is a symptom of a troubled economy - not a healthy one.


On a gold standard, however, this "theft by inflation" is not possible. In fact, the average person gets richer (i.e. can "buy more stuff over time") just by Saving money. When prices go down over time, you can afford more tomorrow than you can afford today. And the longer you Save, the richer you get.

But that only happens if you use sound money.

So the question must be asked:

Would you rather live under the Federal Reserve's monetary policy, or on the Gold Standard?

You may also like:
"Gold is not a hedge against price deflation."